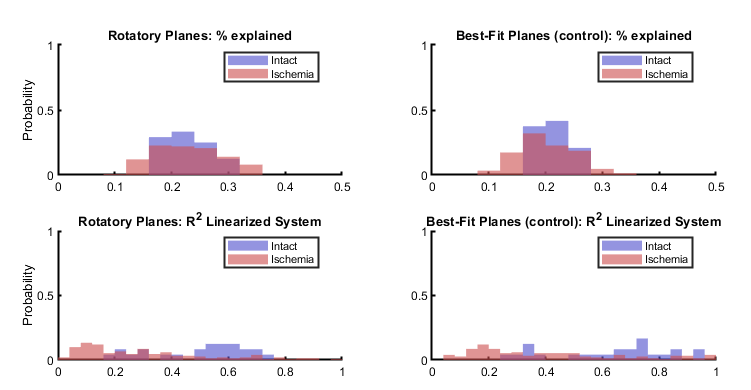
Figure 1: Rats lose typical “rotatory” controller dynamics in spared regions with descending motor control outputs after focal ischemia in M1. We assessed multi-unit spiking on multiple channels in rat PM and M1 simultaneously using a linearized dynamical system model (jPCA method, Churchland et. al 2006) to test the null hypothesis that multiunit dynamics are present during successful pellet retrievals regardless of injury state. Top row: in general, the top-3 planes (sorted by eigenvalues) recovered using jPCA (left) were able to fit the data fairly well, particularly when compared to the positive control (right), which approximated the dynamical system using optimal least-squares regression. The percent of explained data (x-axis) includes the data compression induced by data reduction using the initial PCA pre-processing step. Bottom row: notably, there is a substantial difference in the distributions of how well the linear regression techniques reconstruct the dynamical systems that they are structured to reproduce, with the Intact rats (blue) demonstrating multi-unit activity that is much more parsimonious with the jPCA model (left) than Ischemic rats (red), even when the system is recovered using optimal linear regression without the skew-symmetry constraint (right).
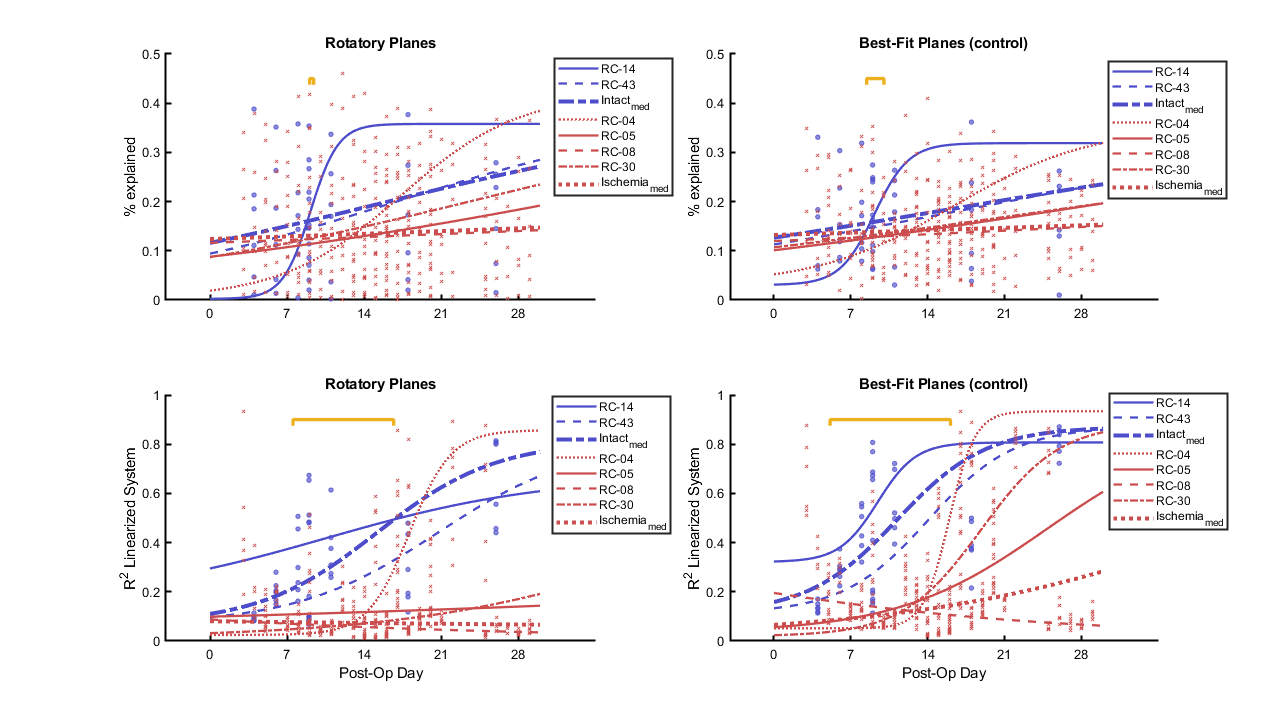
Figure 2: Rats with focal ischemia in M1 demonstrate the greatest loss of rotatory dynamics during post-operative days 8-15, but dynamics re-emerge in the second week after injury in some rats. Panels are ordered so that the top row shows the percentage of the total data that is explained by a recovered rotatory subspace (one pair of complex-conjugate eigenvectors from the least-squares optimal linear transformation that maps the multi-unit principal components onto their time-differences), while the bottom row shows the percent of total variance captured by the linear regression for the same subspaces; left panels represent the jPCA planes (in which the regression was constrained such that the recovered matrix is skew-symmetric), while right panels represent the positive-control, which is the same linear regression problem but without the skew-symmetry constraint. Post-operative day (x-axis) was fit to the response (explained data variance, top; or R2, bottom) individually for each rat using linear regression with a logistic link function (dashed lines). Solid blue (Intact) or red (Ischemia) lines represent experimental group averages; yellow bars denote where the models are significantly different at the level of p < 0.05 (two-way t-tests between model predictions by group for each post-operative day). While there is not a tremendous difference in the overall amount of the data explained by the jPCA plane subspace basis (top left) when comparing the two groups, the amount of the variance in the linearized dynamical systems model captured by jPCA is significantly higher during post-operative days 8-15 in Intact rats (bottom left) than by comparison to Ischemia rats.